Fan, Z., & Loo, B. P. (2025). Urban visual clusters and road transport fatalities: A global city-level image analysis. Communications in Transportation Research, 5, 100193.
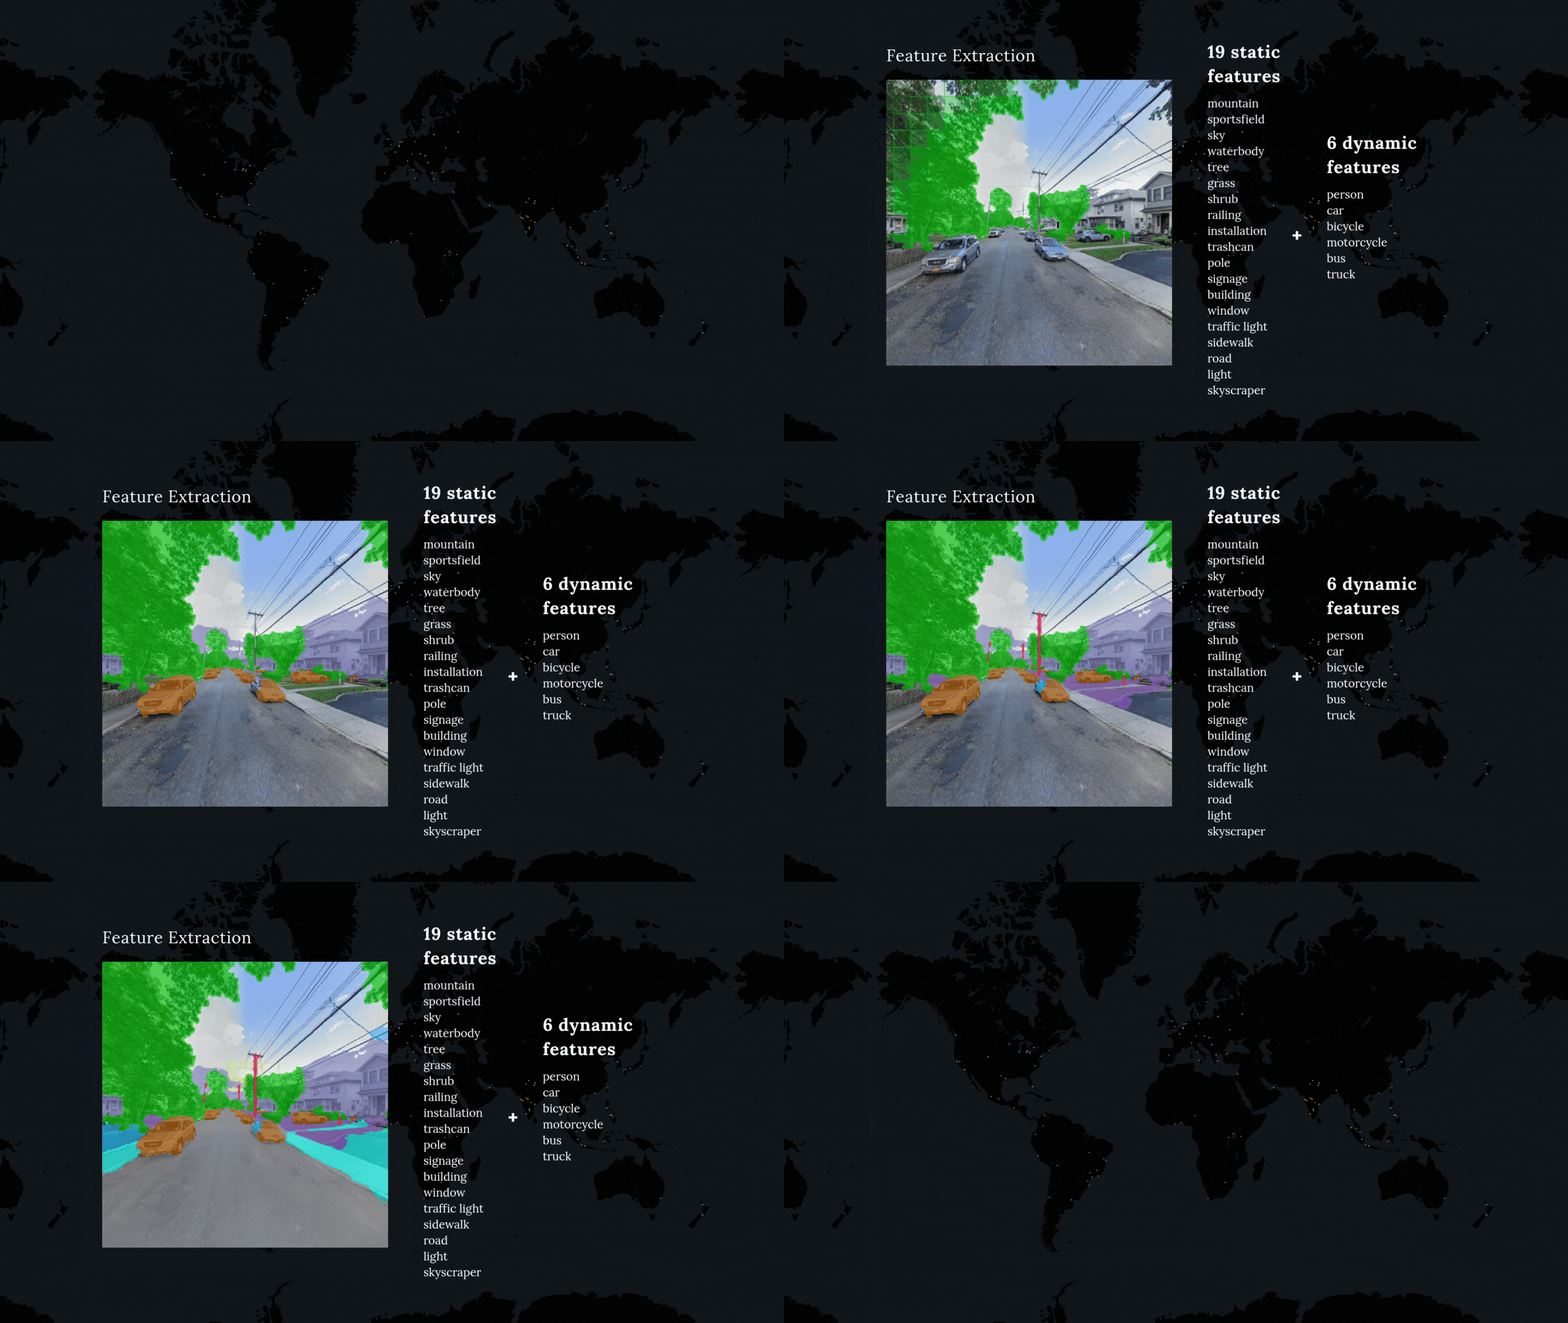
Road traffic crashes are one of the leading causes of death and injury around the world. While urban planning and design are known to influence road safety, it is not clear how features of the built environment contribute to traffic fatalities. In this study, we analyse road fatality data from 106 cities across six continents using a combination of computer vision and unsupervised clustering on 26.8 million Google Street View images. We use deep learning tools to extract 25 features from the images. Among these features, 19 are relatively static built environment features and 6 are dynamic usage-related features (such as pedestrians, cars, buses and bikes). Based on the built environment features, we group the urban streetscapes into six distinct visual clusters. We then examine how these clusters relate to city-level traffic fatality rates, when combined with various control variables (population size, carbon emissions, income, road length, road safety policy and continent) and dynamic features. Our findings show that cities with Open Arterials streetscape (extensive road surface, open sky views and railings) tend to have higher road fatality rates. After accounting for differences in the built environment, cities with better public transit (proxied by buses detected) tend to have fewer traffic deaths—specifically, a 1% increase in bus presence is linked to a 0.35% decrease in fatalities per 100,000 people. This study demonstrates the power of using widely available street view imagery to uncover global disparities in urban design and their connection to road safety.